
After reading "Why Use Historic Maps in the Classroom?" and "Finding Great Maps Online," you must be eager to use North Carolina Maps in your curriculum right away! This essay is designed to guide you through the site, making it as user-friendly as possible. Let’s begin by asking a few questions.
What type of map are you looking for?
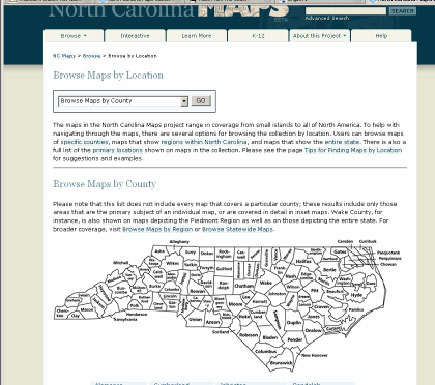
Are you an Environmental Science teacher trying to explain topsoil erosion? A Geography teacher who wants to teach property transfer? When looking for a certain map, the "Browse" feature of North Carolina Maps is very helpful indeed. A drop-down menu at the top of the screen, "Browse" helps you find maps by location, date, subject, or type. For instance, you can choose "Type" to find postal, nautical, or railroad maps, to name a few. Or if you want to show the town of Carthage in 1892, choose "Browse" and then "Date" instead—the site is divided by half-centuries and then again by decade. Choosing "Browse" and then "Location" allows you to find maps by region or even specific county. Just click on the county you want, and a list of all of the available maps for that area will pop up.
What do you want your students to do with the maps?
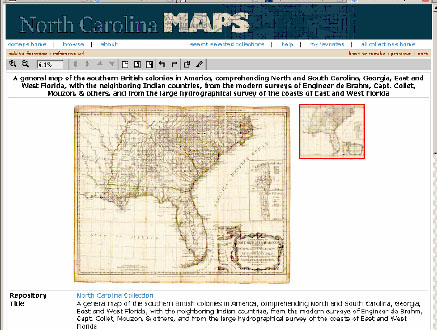
The great thing about NC Maps is that all of the maps come with a lot of information and are able to be manipulated. For instance, let’s look at a map of North Carolina from 1776—an auspicious date for America:
Map Information
What you will see first are two versions of the map—a large one and a smaller one with a red box around it. We will come back to the red box in a minute; first, let’s review the information that comes with the map. You can see above the map the title in bold. The repository, or who holds the map, is beneath, as well as the title again. Now let’s scroll down a bit and find out what else we can tell about the map.
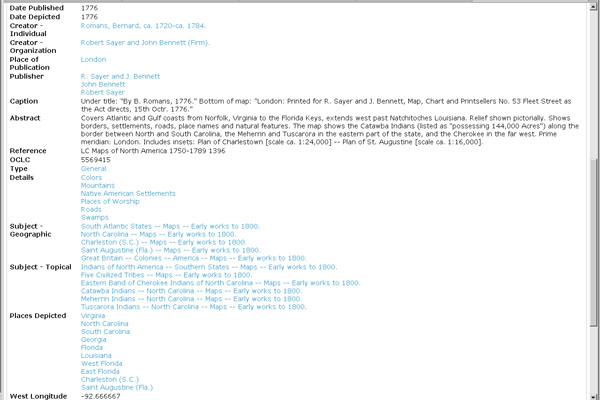
As you can see, there is a lot of information! Students can note the date the map was published, the place of publication, the caption, an abstract, longitudes and latitudes covered, and even what type of material the map is printed on. In other words, the story of the map itself is told. We know from this map, for instance, that it was printed on paper in London in 1776 and shows all the way from Virginia to Florida. The map also tells us that the Catawba Indians possessed 144,000 acres at the time and that America was still considered a British colony. All of that history, from one piece of (very large) paper!
You will also notice all of the words that are highlighted in blue. Just click on "Virginia" and you will be directed to the other maps in the collection showing Virginia. Click on "Catawba Indians" for dozens of other maps depicting the tribe. It is very easy to find related information using this feature on NC Maps.
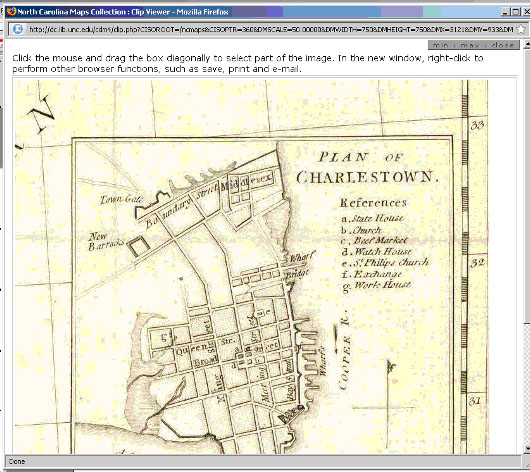
Manipulating the Maps Let’s get back to that red box. All of the maps on the site are able to be manipulated—you can zoom in, scroll up and down, and cut out parts of the map for your use. For instance, say you want your students to just look at the plan for Charlestown on this map, because you are going to begin a lesson on the slave trade in America. Clicking on the area of the map that includes "The Plan of Charlestown" causes two changes to occur:
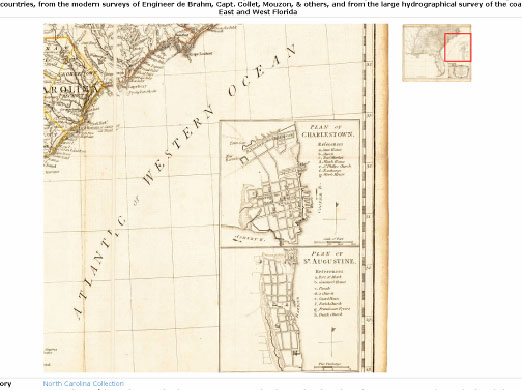
The map zooms in on the "Plan of Charlestown", and the red box closes in around where you have zoomed. The more you click on the map, the closer in the map will zoom—students can pick out King Street if they zoom in enough! You can click on the smaller map, outside the red box, to move the map over. The tool box above allows students to manipulate the map in a variety of ways.
The two magnifying glasses zoom the map in and out, and the arrows move the map up and down. The three page icons bring the map back to its original size and allow the user to choose how much of the screen it fills. The two jointed arrows rotate the map, while the box-in-box hides the smaller version if you wish.
Imagine that your students are writing a paper about the planning of Charleston, and they want to use the plan in this particular map as an illustration in their document. This is where the small cutting tool becomes very useful. Once the student has zoomed in to the point on the map she wants to use, a click on the cutting tool will open only that portion of the map in another window. Then they drag a box around only what they want to copy, and they have their image.
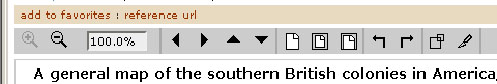
Of course, if students use or reference a map in a project or document, you may require that they cite the source in a bibliography. If you look back at the toolbox:
You can see "reference url" in red. Clicking on this link causes the reference url to pop up in a new window to easily save and use for later.
Interacting with the Maps If you go back to the NC Maps homepage, you will notice a tab at the top labeled "Interactive." This is a relatively new technology called "Historic Overlay Maps" that is fun and informative for students to use. If you are familiar with Google Maps or Google Earth, it may look familiar to you. The idea behind Historic Overlay Maps is that maps showing periods from North Carolina history are geo-referenced over current maps and then faded, so students can see how the geography or landscape has changed over time. For example, let’s look at a map of Charlotte, comparing present day to 1877. First, we begin with the present day map.
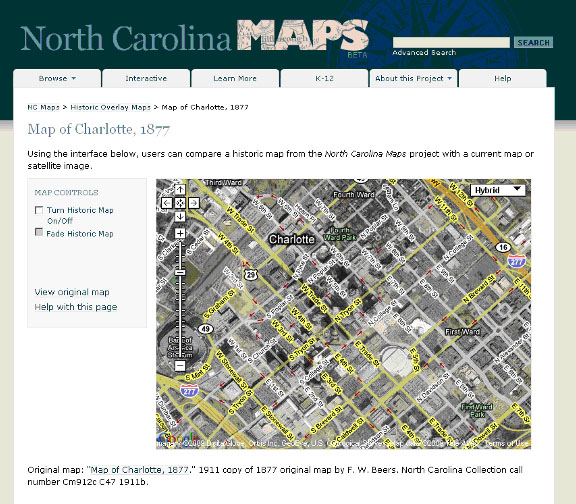
Notice a few features on the map itself: there is a control to zoom in and out and north, south, east, and west, as with a typical Google map; there is also a drop down menu at the top right corner set to "Hybrid." This mixes a satellite image with a terrain/street map. You can change that menu to just "satellite" or just "terrain," depending on what you are teaching. Now, under "Map Controls," we’ll turn on the Historic Map by clicking the box.
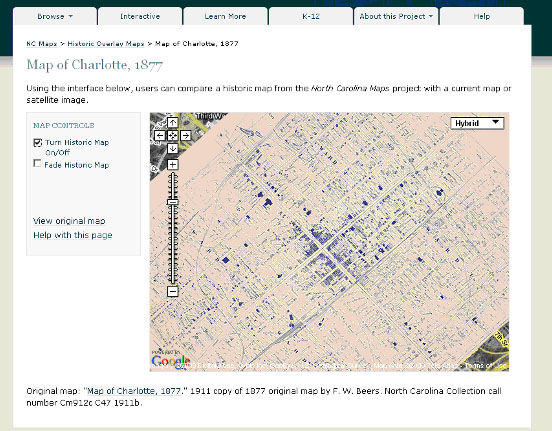
You can zoom in and look at what Charlotte used to look like and where the major streets, buildings, and landmarks were in 1877. Now, see what happens when we use the "Map Controls" to fade the historic map.
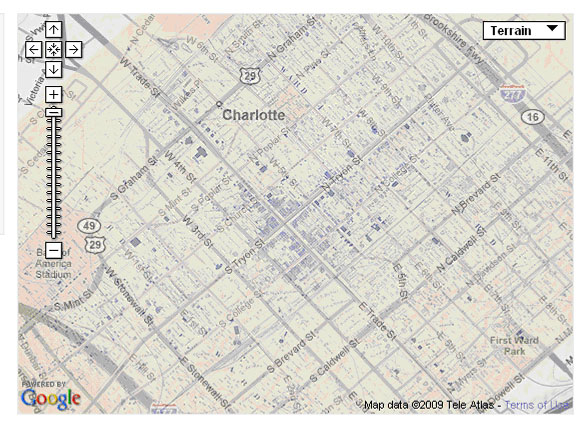
Now we can see right in front of us the changes that have been made in 130 years! The more you zoom in, the more you can find comparisons to be made.
What else can my students or I find on the North Carolina Maps site? Back at the homepage, you will see a tab at the top labeled "Learn More," which has three important links. The first is "Shaping North Carolina, 1500-1775," an essay about mapping North Carolina by H.G. Jones. The second is a bibliography giving links to other great resources for studying North Carolina. And the third is the "Timeline," a color-coded listing of significant events and maps dating from 1585 to 1938.
Finally, on the homepage there is a tab labeled "K-12" that is just for you, the teacher. This tab links you to a multitude of resources for teaching North Carolina maps, including essays on methodology and ready-to-go lesson plans for the digital classrooms of today. Lesson plans literally range from kindergarten to high school, so there is something for every age range. And think that only history teachers teach maps? On this site you will find teaching materials for science, language arts, and even math teachers.
We hope you find North Carolina Maps to be a useful, informative site. Please contact us with any feedback or ideas you may have at ncmaps@unc.edu.