
Lesson Plan - Population Growth and Movement in 19th Century North Carolina
A Lesson Plan for Grade 8 Social Studies
By Jennifer Job, School of Education, UNC-Chapel Hill
Objectives: Students will explore the movement of populations during the 19th century with focus on major growth in industry and transportation by using atlas maps from the period and other resources. Students will analyze reasons for migration and city growth and present these reasons through use of technology.
This lesson plan is available as a formatted worksheet which can be printed and distributed. Download the worksheet by clicking the title: population_k12.pdf
Time Required: Two fifty-minute class periods.
Materials:
- Handout (.pdf)
- Computer lab equipped with Internet access
- Smartboard
Teacher Instructions:
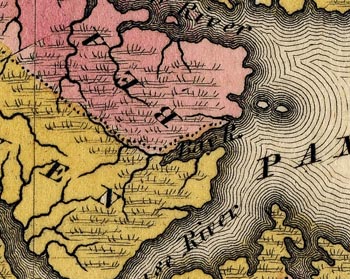
- On individual computers, give students twenty minutes to study the "Geographical, Statistical, and Historical Map of North Carolina," published in 1823 by Carey and Lea. They should not only look over the county development and organization but read the text on the bottom of the map, focusing especially on the county populations, "Chief Townes," and "Internal Improvements”. Have them note which counties are the most and least populous and where they are generally (north, south, east, west) in North Carolina.
- Divide students into five groups. Assign each group an area of North Carolina—mountains, southern piedmont (Mecklenburg and surrounding counties), western piedmont (Guilford, Alamance, Orange, Chatham, and western counties), eastern piedmont (Durham, Wake, and counties north and south of them), and coastal.
- Hand out the worksheet (.pdf) to each group, or, preferably, have them open a copy on the computer they will be using.
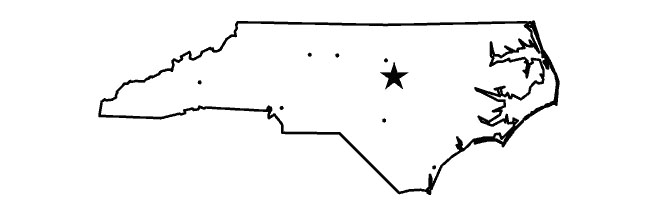
- After students have completed the worksheet, bring them together around a Smartboard showing two blank maps of North Carolina with only the areas assigned outlined (see example below). Label one map 1823 and the other 1892.
- Have each group come up and mark the population of the area on the 1823 map. You can decide to let them write numbers or color code according to your own legend. After the map is completed, discuss with students where the highest population is, where certain populations are concentrated, and what the reasons for these factors may be.
- Ask each group to come up and present about their area. On the Smartboard, they should both draw in population centers (major cities, etc.) on the map and also landmarks that associate with their reasoning behind the population change (railroad routes, etc.). Students can also use the Smartboard to bring up pictures or other graphics they found in their research.
- Conclude with a discussion about mobility and population growth. You can extend this discussion by showing the population change that has taken place in your own particular county in the last 10 or 20 years.
Assessment:A rubric-based analysis of presentations would be appropriate. Good rubrics may be found at http://www.uwstout.edu/soe/profdev/rubrics.shtml.
Population Growth and Movement in 19th Century North Carolina
Group Members:
Area of North Carolina:
One cause of population change (to be answered LAST):
- What is the population of North Carolina in 1823 according to the Carey and Lea map?
- What is the population of North Carolina in 1890 according to the US Government Census? (Consult http://ncmuseumofhistory.org/ for census data.)
- Describe the changes in total population. What populations grew and by how much? What populations declined and by how much? What new populations are counted?
- What are your theories as to why these population changes took place?
- Now focus on your area of North Carolina in 1823. Comparing your area to the rest of North Carolina, do you find your area to be more populous, less populous, or in the middle? Why do you think so?
- According to the 1823 map, what seem to be the major cities in your area?
- Now look at Rand, McNally and Co.'s 1892 map (http://www.lib.unc.edu/dc/ncmaps/). What are the populations of these cities 70 years later? List all of the major cities in your area and the populations according to the map (populations are along the sides).
- Considering the total population of the cities you listed, has your area grown in size or shrank since 1823 compared with other cities/areas you see on the map?
- Here's the part that requires a lot of thinking! What is a reason for your answer to #8? Read the history located on the 19th Century North Carolina page where you found the census data. Now, go on DocSouth's site (http://docsouth.unc.edu/browse/collections.html) and browse through the "North Carolina Experience” collection. Decide as a group on one specific reason for the population change in your area. It can fall under the categories of transportation, politics/social change, agriculture, technology, or exploration (or a combination). One exception: you may NOT use "The Civil War” unless you can point to a highly specific reason why this caused more change in your particular area than others. Write a paragraph AS A GROUP explaining your reason and the players (companies, people, etc.) who drove it. If you use outside sources, be sure to cite them. Then, write your reason on the blank at the top of the page.
North Carolina Curriculum Alignment
Eighth Grade SCOS
3.01 Investigate the conditions that led to North Carolina's economic, political, and social decline during this period and assess the implications for the future development of the state.
5.01 Identify the role played by the agriculture, textile, tobacco, and furniture industries in North Carolina, and analyze their importance in the economic development of the state.
7.02 Evaluate the importance of social changes to different groups in North Carolina.
8.01 Describe the changing demographics in North Carolina and analyze their significance for North Carolina's society and economy.